


GeoGebra
You can use GeoGebra to draw curves using their parametrization:
-
If you need to find the parametrization of a line, see Item 4. When you find the parametrization, the line itself will also be drawn automatically.
-
If you want to draw curves in the plane, see Item 3.
-
If you want to draw curves in space, see Item 2.
GeoGebra Instruction 1
Find the Parametrization of a Line
- 1.
- Open
3D GraphicsandAlgebra Viewunder
Viewin
Menu. - 2.
- If you have a direction vector, enter it in
Algebra Viewusing the commandVector(<Point>)
for the command in the next steps to work. Note the name of the vector in
Algebra View, as you will need it later. - 3.
- Depending on the information you’re given, do the following in
Algebra View:-
If you have a point and a direction vector, enter
Line(<Point>, <Direction Vector>)
and replace
<Point>with your point and<Direction Vector>with the name of the vector from Step 2. -
If you are given two points, enter
Line(<Point>, <Point>)
and replace both
<Point>fields with each of your points.
The line now appears in
3D Graphics. You can also see the parametrization inAlgebra View.Note!
GeoGebrauses the Greek letter for the parameter, instead of the usual . -
- 4.
- To move around in
3D Graphics, clickRotate 3D Graphics view .
.
Example 1
Find the parametrization of the line through the point
with direction vector
Following Item 4 above, type
Line(<Point>, <Direction Vector>)
in its own line in Algebra View. Then type
Line(<Point>, <Direction Vector>)
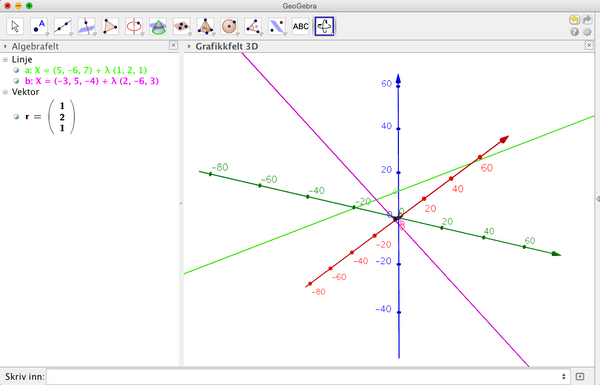
and replace <Point> with (5, -6, 7) and <Direction Vector> with the name of the vector. You will then get the parametrization
Example 2
Find the parametrization of the line through the points
and
Following Item 4 above, type
Line(<Point>, <Point>)
and replace the first <Point> field with (-3, 5, -4) and the second <Point> field with (-1, -1, -1). You will then get the parametrization
GeoGebra Instruction 2
Drawing a Curve in the Plane Using a Parametrization
- 1.
- Open
Algebra ViewandGraphics Viewunder Viewin Menu. - 2.
- Use the command
Curve(<Expression>, <Expression>, <Parameter Variable>, <Start Value>, <End Value>)
in
Algebra View. Make sure you use the version where there are two<Expression>fields (there’s another one with three). - 3.
- Enter the expressions of and —in that order—in the
<Expression>fields. Enter as<Parameter Variable>, and set the start value and end value in the<Start Value>and<End Value>fields. PressEnter.Your curve will appear in
Graphics View. Also, the parametrization will be printed inAlgebra View.
Example 3
Draw the curve with the parametrization
and
with 0 as start value and 50 as end value of parameter .
Following Item 3 above, use the command
Curve(<Expression>, <Expression>, <Parameter Variable>, <Start Value>, <End Value>)
by replacing
-
The first
<Expression>field with3t -
The second
<Expression>field witht+4 -
<Parameter Value>witht -
<Start Value>with0 -
<End Value>with50
The planar curve will appear in Graphics View and parametrization in Algebra View.
GeoGebra Instruction 3
Drawing a Curve in Space using a Parametrization
- 1.
- Open
Algebra Viewand3D Graphicsunder Viewin Menu. - 2.
- Use the command
Curve(<Expression>, <Expression>, <Expression>, <Parameter-variable>, <Start>, <End>)
in
Algebra View. Make sure you use the one where there are three<Expression>fields (there’s another one with three). Enter the expressions for , and , in that order, for<Expression>. Enter as<Parameter Variable>, and set the start and end values to for<Start>and<End>. PressEnter.Your curve will appear
3D Graphics. Also, your parametrization is given inAlgebra View.To change the perspective in
3D Graphics, select theRotate 3D Graphics view tool and use the cursor to change the perspective to your liking.
Example 4
Draw the curve with the parametrization
and
with 0 as start value and 100 as end value of parameter .
Following Item 3 above, use the command
Curve(<Expression>, <Expression>, <Expression>, <Parameter Variable>, <Start Value>, <End Value>)
by replacing
-
The first
<Expression>field witht -
The second
<Expression>field with-2t+1 -
The third
<Expression>field witht+2 -
<Parameter Value>witht -
<Start Value>with0 -
<End Value>with100
The spacial curve will appear in Graphics View and parametrization in Algebra View.
