


GeoGebra
Menu
How to Make a Bar Chart with GeoGebra
There are two ways to make a bar chart in GeoGebra. The first way is to use a list of observations, which is the easir of the two. The second way is to use a frequency table.
GeoGebra Instruction 1
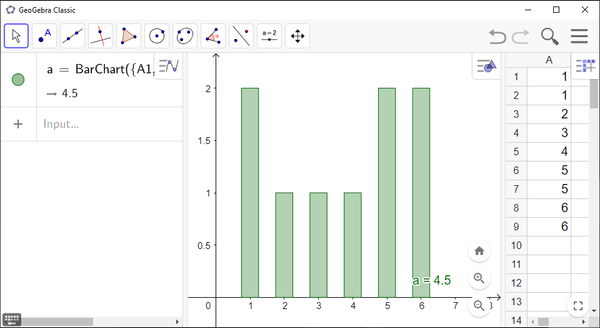
Bar Chart from a List of Observations
- 1.
- Open
Algebra View,Graphics ViewandSpreadsheetmode under
Viewin
Menu. - 2.
- Enter all your observations into column
A. - 3.
- Mark all your observations and select the
One Variable Analysis tool.
tool. - 4.
- You’ll get a new window with a histogram.
GeoGebradisplays a histogram by default, so you need to selectBar Chartfrom the drop-down list at top of the window. - 5.
- Click
Copy to Graphics View to move the chart to
 Graphics View. You can also change its properties by right-clicking and choosingSettings.
GeoGebra Instruction 2
Bar Chart from Frequency Table
- 1.
- Open
Algebra View,Graphics ViewandSpreadsheetunder Viewin Menu. - 2.
- Enter all your values in column
A. - 3.
- Make a list by highlighting all your values and clicking
List . In the pop-up-window, change
 NametoDataand clickOK. - 4.
- Enter all your frequencies in column
B. - 5.
- Make a list by highlighting all your frequencies and clicking
List . In the pop-up-window, change NametoFrequenciesand clickOK. - 6.
- In
Algebra View, typeBarChart(<List of Data>, <List of Frequencies>)
and replace
<List of Data>withData, and<List of Frequencies>withFrequencies.The bar chart will now be displayed in
Algebra View.